Tutorial - The
Arabidopsis
Leaf scRNA-Seq Atlas
Tutorial download
The scRNA-Seq expression atlas of the
Arabidopsis
leaf comprises transcriptomes of 5,230 individual leaf cells (Kim et al., 2021). The ‘tape-sandwich’ method was undertaken on leaves from 6 weeks old, short-day grown plants to enrich for vasculature cells. For this, the abaxial leaf surface was removed and as such, the trichomes, guard cells, and epidermis of the abaxial surface are not within this dataset (see Kim et al. methods and supp. Figure 1 for further details). Sequencing to a depth of ~96,000 reads per cell was undertaken, which identified a median number of 3,342 genes and 27,159 unique transcripts per cell.
In the leaf single-cell RNA dataset, mesophyll and vascular cell types are distinctly arranged, reflected by their position within UMAP plots. A cluster map serves as an easy key to infer gene expression patterns displayed in UMAP and violin plots. A subset of the data focusing on the vasculature clusters and their subclusters provides more specialist information. This tutorial guides in understanding expression profiles beyond the main cell clusters and to fully utilise the extensive data.
1. Querying Genes
Genes can be queried either by entering individual (≤4) gene IDs in the search bar to the left (‘Enter Gene IDs’; Figure 1A), or through the upload of a gene list (≤20 genes), as indicated (Figure 1B). For genes not detected in the dataset, or if they are induced by the protoplast-preparatory procedure, a notification will appear under the gene search box (see the ‘Arabidopsis root’ tutorial, Figure 2). Under the ‘UMAP’ tab, up to 4 UMAP plots will automatically be displayed (Figure 1C). These can be downloaded as a .png file. For inquiries exceeding four genes, UMAP plots can be downloaded (Figure 1D). For a more focused view of the vasculature clusters and subclusters thereof, a second tab opens up a parallel page with the same functionality on a subset of the cells (Figure 1F). The vasculature subclusters are described in depth in Kim et al., 2021. Aside from the 2D cluster maps and gene-specific UMAP plots, a 3D representation of the cluster cloud is available in a separate tab (Figure 1J). This can prove helpful when considering expression spatially within clusters.
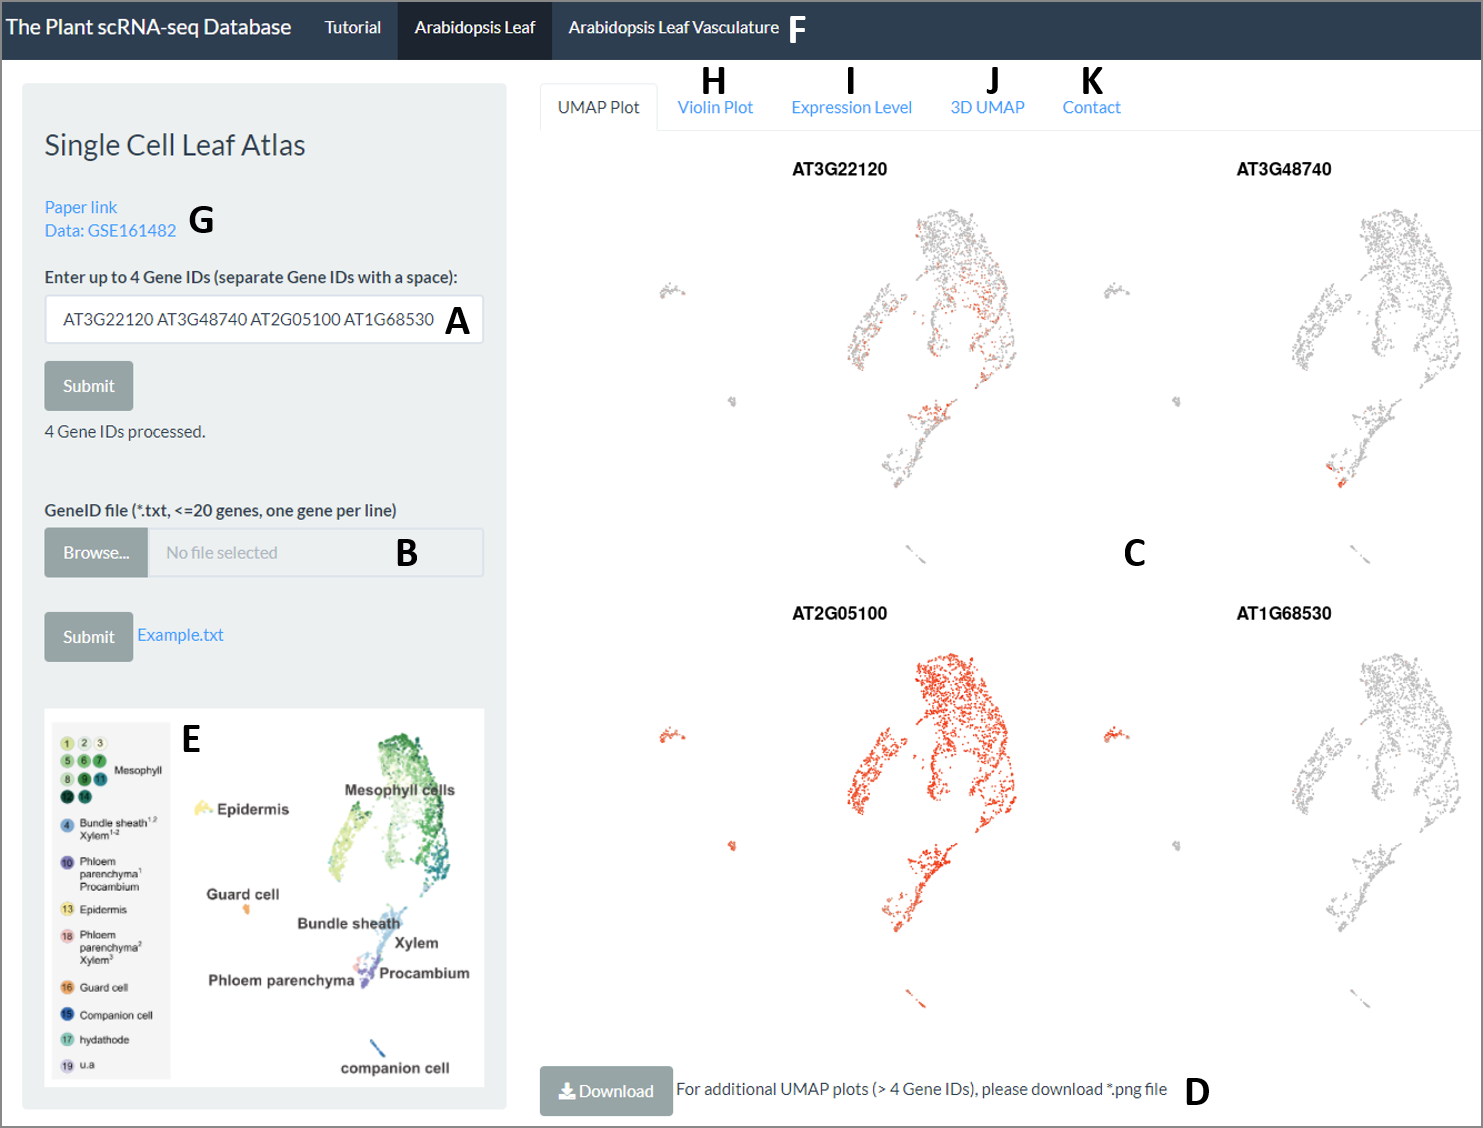
Figure 1.
The leaf scRNA-Seq Browser interface. (A) Individual (≤4) genes can be queried. (B) Alternately, a gene list (≤20 genes) can be uploaded. (C) For genes detected in the dataset, UMAP plots are displayed showing expression across the clusters of cells. (D) UMAP plots are downloadable as a .png file. (E) The accompanying cluster map aids with the quick initial interpretation of expression data. (F) A second tab provides data for vasculature cell type subclusters, as described in Kim et al. (2021). (G) Links to relevant documents and the raw data are displayed. (H) Violin Plots depict expression distribution across clusters (downloadable). (I) Quantitative expression values are available under the 'Expression level' tab (downloadable). (J) A 3D representation of the clusters is likewise available on a separate tab. (K) Contact information for technical questions regarding the website or data can be found in a separate tab.
2. Interpreting your UMAP plots
A first interpretation of the UMAP plots is provided by the cluster map (Figure 1E). However, the leaf atlas captures expression information at a resolution far beyond the main clusters highlighted in the map. Accordingly, many genes show expression in just a subset of cells within a cluster. While a dispersed pattern of expressing cells more likely reflects a level of expression nearing the probability of detection, expression in a defined subsection of a cluster is typically indicative of more intricate distinctions between cells. It is important to note that a lack of transcript enrichment depicted on the UMAP plot does not necessarily preclude expression – simply that it was not detected. As such, caution, and the use of suitable marker genes to reinforce assertions about the expression profile of a gene of interest is advised.
The 19 main clusters cover all major cell types - mesophyll, epidermis, vascular, and guard cells. It is of note that eleven of the clusters appear to comprise mesophyll cells, based on enrichment of well-established marker gene expression (for example, CAB3 and LHCB2.1). The multiple mesophyll clusters highlight the complexity of this tissue and how this kind of data serves as a source to identify cell type/state heterogeneity. We know that Arabidopsis leaf mesophyll is composed of (at least) two principal cell types: spongy and palisade. Although these types show significant differences in morphology, specific markers for each are currently scarce. We can putatively designate C2 and C7 as spongy parenchyma, given the transcript enrichment of the marker gene FIL (YAB1), for example, and there are many specific genes across the 11 clusters. It is essential that the identity of closely related clusters is experimentally validated.
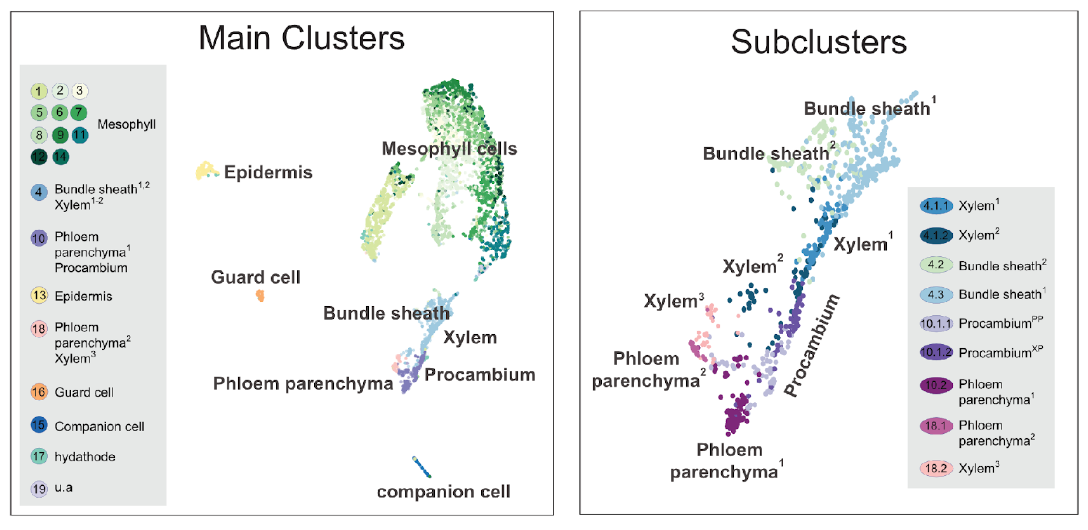
Figure 2.
The leaf scRNA-Seq clusters. The broad dataset comprises all major cell types of the
Arabidopsis
leaf (left), but further scrutiny of the vasculature clusters reveals the complexity of the data and further subdivisions both between, and within cell types (right). Please refer to Kim et al., 2021 for detailed information about the main and subclusters.
Besides the 18 clusters and subclusters which could be assigned to a cell type in the leaf, C19 was left unassigned due to the ambiguous expression profile. C19 is enriched for genes involved in programmed cell death and the insect chewing-induced glucosinolate biosynthetic pathway genes indicating that cells in this cluster could represent glucosinolate accumulating ‘S-cells’.
3. Cross-cluster comparisons
For ‘Violin plot’ and ‘Expression Level’ data visualizations, please see Figures 7 and 8 in the ‘Arabidopsis root’ dataset tutorial.
The ‘Violin Plot’ option depicts the distribution of cells with a given expression value in each of the 19 main clusters. The y-axis displays gene expression level while the x-axis represents the proportion of cells showing this expression value. All plots are downloadable as .png files. This feature provides an additional measure of cluster specificity. For example, CABs are broadly expressed (in all photosynthetic cell types) whereas CUT1, a marker for the epidermis, is specifically expressed in Cluster 13. FAMA, a marker for guard cells is specifically expressed in cluster 16, and SWEET11 and SWEET12, markers for phloem parenchyma are expressed in a large percentage of cells in clusters 10 & 18.
UMAP expression scales are unique to each individual UMAP plot. For quantitative expression levels, click on the 'Expression level' tab. This option offers comprehensive information on gene expression values across the clusters. Specifically, upon a query, tables summarizing mean expression per cell and the percentage of cells expressing a given gene in each cluster are produced. Alongside these are histograms depicting the expression values as average Unique Molecular Identifier (UMI) counts per cell across clusters. The data is downloadable as a comma-separated .csv file. Please note, for multi-gene searches, data for just the first gene will be displayed, the data for all genes is downloadable.
4. General Comments
Deep interpretation of the leaf scRNA-Seq atlas may require a little practice. It is worth noting that none of the clusters are 'pure'. Most clusters encompass the occasional cells with an apparent different identity that may be displaced due to the nature of the technology and clustering techniques. However, from the scale of the data, it should be clear whether such occurrences have bearing on your conclusions. In addition, while scRNA-Seq is a very sensitive method that is being refined and improved at a rapid pace, at present, only a proportion of transcripts per cell are detected. Therefore, please remember that this data should not be used to make inferences on where a gene is not expressed, only that it was not detected!
Should you have any questions regarding the data, please first refer to the paper (Kim et al., 2021). However, for additional advice regarding the interpretation of gene expression data, please feel free to contact Jiyun Kim or Wolf Frommer (jiyun.kim@hhu.de, frommer@mpipz.mpg.de) who will try to help if possible.
For technical advice on using the website or should you encounter any bugs, please contact Pavel Solanský (pavel.solansky@zmbp.uni-tuebingen.de). For any suggestions on the browser, or should you wish to enquire about the browser hosting your dataset, please do not hesitate to contact Marja Timmermans (marja.timmermans@uni-tuebingen.de).
5. Reference
Kim JY, Symeonidi E, Pang TY, Denyer T, Weidauer D, Bezrutczyk M, Miras M, Zöllner N, Hartwig T, Wudick MM, Lercher M, Chen LQ, Timmermans MCP, and Frommer WB. 2021. Distinct identities of leaf phloem cells revealed by single cell transcriptomics. Plant Cell. 33(3), 511-530